Eclipse · Energy Insights

Your home’s energy, made clear.

Track real-time energy use, monitor your PV system and join energy communities. Eclipse turns complex energy data into clear, actionable insights.

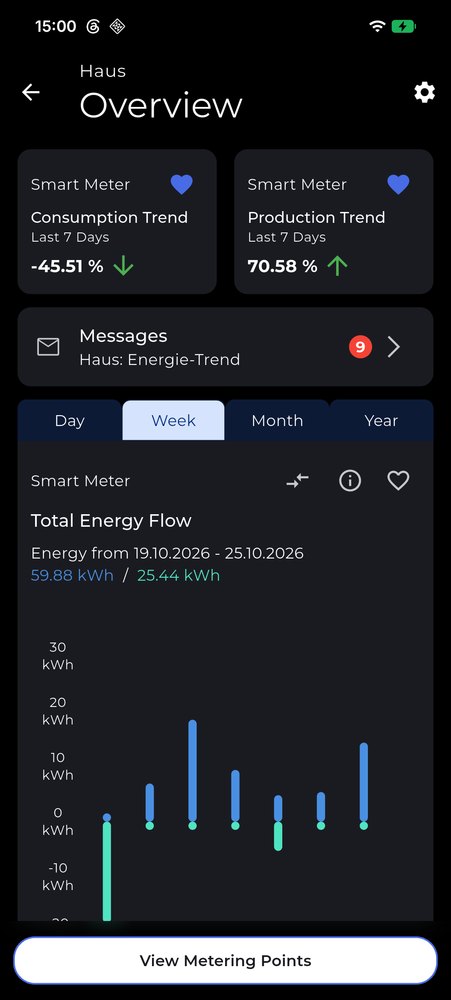
Smart meter overview with consumption and production trends and weekly energy flow
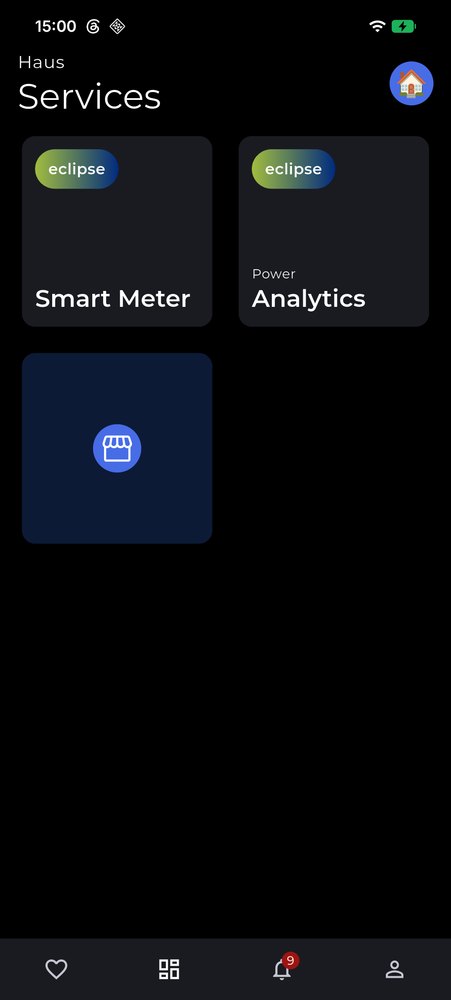
Eclipse services: Smart Meter and Power Analytics
Services

Your energy services, in one app.

Start with Smart Meter and Power Analytics today. Eclipse is built to grow: more independent services will join over time.

2027New grid fees in Austria

Power Analytics: see your peaks before they count.

From 2027, peaks start to matter: part of your grid fee will depend on your strongest quarter hour of the month. Keep scrolling to see on an example day how Eclipse makes your peaks visible.

From 1 January 2027, households in Austria also pay a power price. It is based on your highest 15-minute peak each month; grid areas switch over by 1 July 2028 at the latest. Power Analytics shows when your peaks happen, so you can spread out the load from your EV, heat pump or oven.

Source: E-Control, Systemnutzungsentgelte-Grundsatzverordnung, BGBl. II Nr. 299/2026

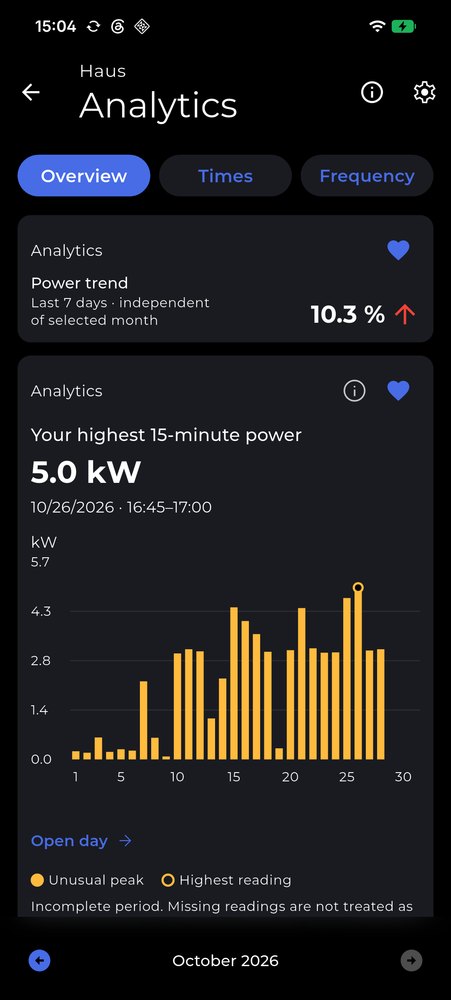
  • Overview: your highest 15-minute power, power trend and unusual peaks
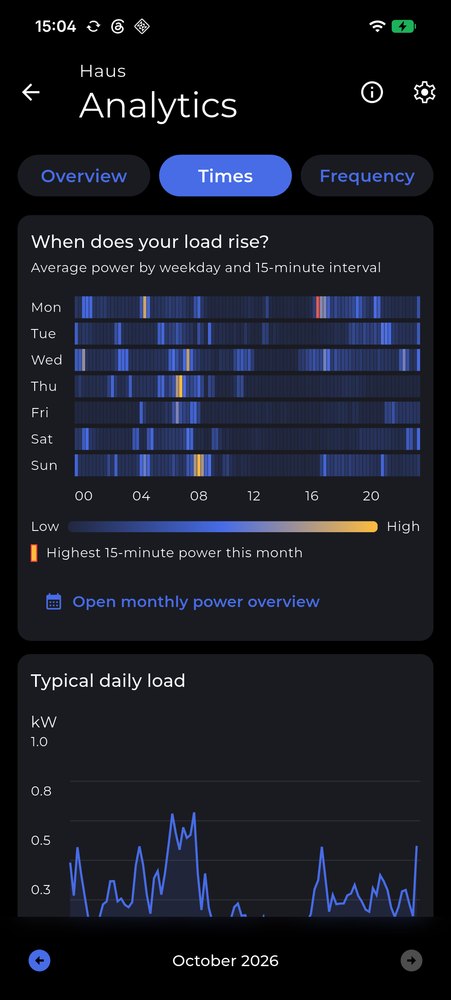
  • Times: heatmap of when your load rises, plus your typical daily load
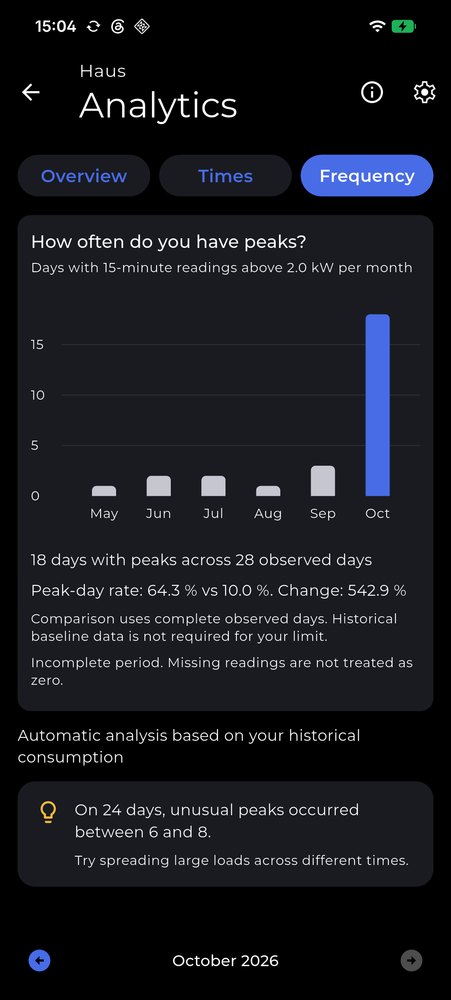
  • Frequency: set your own peak limit and see how often you exceed it
  • Daily detail: your three highest readings of any day

Eclipse analyses your power peaks. It does not calculate grid costs.
Example day, 15-minute readings. Eclipse shows your own load profile like this.
Power Analytics frequency view with a custom peak limit
Power Analytics overview with the highest 15-minute power of the month
Power Analytics heatmap showing when the load rises

via your grid operator

Smart Meter

Validated consumption and production data from your smart meter. See where your energy goes, how it changes and how much you share with your energy community.

  • Energy communities

    See which share of your consumption and feed-in runs through your energy community.

  • Comparison & trends

    Compare consumption and production with the previous period at a glance.

  • Day to year

    Browse your history by day, week, month and year, down to 15-minute values.

  • PV & multiple homes

    Follow PV production and feed-in, for every residence and metering point.

Smart meter overview with consumption and production trends and weekly energy flow
How it works

Up and running in three steps.

Set up once, then Eclipse keeps your energy data up to date.

  1. Create your account

    Download Eclipse for iOS or Android and sign up with your email address.

  2. Connect your smart meter

    Add your residence and enter your metering point number, then grant access to your smart meter data.

    Starts with AT · 33 characters · on your electricity bill

  3. Understand your energy

    Follow consumption and production, analyse your 15-minute peaks and build your own dashboard.

The ECLIPSE project

Part of a European movement for smarter energy use.

The Eclipse app is developed by FH Upper Austria within ECLIPSE (Energy Consumption reduction based on Open-source Reference Framework). The project empowers consumers across Europe to reduce and shift their energy consumption, using transparent data on savings, CO₂ and financial incentives.

Visit eclipse-digital.eu
Co-funded by the European Union
FH OÖ – University of Applied Sciences Upper Austria
FFG – Austrian Research Promotion Agency
Funding application
Energy Consumption reduction based on Open-source Reference framework
FFG project number
FO999919128
eCall application number
56881546
Call
Nationale Ko-Finanzierung Digital Europe 4. Call

Co-funded by the European Union under the DIGITAL EUROPE programme, Grant Agreement No. 101158494.

Take control of your energy.

Eclipse is free on iPhone, iPad and Android.